Property Managers: Package Forecasts Top 300/Week? Add Lockers, Staff
Property Managers: Package Forecasts Top 300/Week? Add Lockers, Staff Forecast package volume by converting measured packages-per-unit into monthly and peak-day projections, then applying seasonal and growth multipliers on top. The formula
Published

Forecast package volume by converting measured packages-per-unit into monthly and peak-day projections, then applying seasonal and growth multipliers on top. The formula is straightforward: measured packages per unit type, multiplied by unit counts, rolled into monthly totals, adjusted for seasonality and growth, and converted into daily intake and peak-day capacity needs. You need inputs such as measured counts, unit mix, expected growth, seasonal multiplier, and oversize package share to forecast volume. The sample projection and capacity math below walk through exactly how.
TL;DR:
- Packages per unit per week typically range from 0.3 to 0.5 for standard properties, but urban and high-density sites can exceed this significantly.
- Holiday surges can double weekly volume, and peaks during Black Friday to New Year’s require capacity planning beyond typical averages.
- Forecasting should include growth scenarios up to 10%+ annually and account for oversize packages and carrier mix shifts to stay accurate over multiple years.
- Building capacity requires sizing for peak-day volume, reserving surplus space, and choosing hardware options like lockers and shelves based on forecasted growth and oversize share.
- Staffing needs increase sharply once weekly packages surpass 80 to 100, making managed package room visits or automation essential for high-volume properties.
Table of Contents
- Package Volume Benchmarks Every Property Manager Should Know
- How to Forecast Package Volume: A Step-by-Step Method
- What Drives Package Volume Beyond the Baseline
- Converting Package Forecasts Into Space and Hardware Needs
- Staffing Needs Tied to Your Package Forecast
- Implementation Checklist and KPIs to Track
- Postal Solutions: Matching Services to Forecast Thresholds
- Handling Returns and Reverse Logistics in Your Forecast
- Author Perspective: What the Data Doesn’t Tell You
- Turning Your Forecast Into a Working Package Room
- Sources
- FAQ
Package Volume Benchmarks Every Property Manager Should Know
Guessing at package volume is how properties end up with overflowing shelves by the second week of December. The better starting point is a set of industry benchmarks you can compare against your own counts.
An NMHC survey found that typical apartment communities receive about 100 packages a week, with package holding areas ranking among residents’ top-valued amenities. That figure works as a midpoint benchmark for a conventional multifamily property, not a ceiling. Some practitioner guidance suggests planning for roughly three parcels per household per week as a conservative upper bound during the first weeks of lease-up, when new resident habits are still forming.
Scale changes the math fast. A 200-unit property running near the NMHC benchmark might see 60 to 100 packages a week, while a 400-unit urban building can run far higher. One documented case put a 400-unit New York building at 187 packages arriving in a single day, which is closer to 1,300 a week during a normal stretch, before any holiday surge.
Quick benchmark reference:
- Conventional multifamily: roughly 0.3 to 0.5 packages per unit per week baseline
- Student housing near move-in or finals periods: spikes well above that baseline
- Urban high-density properties: can exceed 1 package per unit per week even outside peak season
Nationally, parcel volume hit 23.1 billion shipments in 2025, and Pitney Bowes projects growth toward 31 billion by 2031. Build that trajectory into any multi-year capacity plan, not just next quarter’s staffing schedule.
Resident profile matters more than raw unit count. A senior housing community with lower online shopping rates will run below the NMHC benchmark, while a student housing property near a university, where residents order textbooks, dorm supplies, and food delivery constantly, often runs well above it.
How to Forecast Package Volume: A Step-by-Step Method
Forecasting package volume for an apartment community comes down to four repeatable steps. Skip the first one and everything downstream is guesswork.
-
Measure a representative week. Pull scan logs from your package room software, or if you’re not there yet, do manual counts for seven straight days, including a weekend. Track total packages, oversize share (anything too large for a standard locker compartment), and average dwell time, meaning how long parcels sit before pickup.
-
Compute base rates by unit type. Studios, one-bedrooms, and two-bedrooms rarely generate identical volume. A studio occupied by a single young professional often orders more than a two-bedroom with a family that shops in person. Divide your measured week’s count by unit type to get a per-unit rate, then multiply each rate by how many units of that type exist on the property.
-
Apply seasonal and growth multipliers. Holiday weeks can significantly increase normal volume based on industry survey data, so build a multiplier of 1.8x to 2.2x for the November through December stretch. Layer a growth scenario on top: conservative (flat to 3% annual growth, tracking general e-commerce trends), likely (5% to 8%), and optimistic (10%+, appropriate for properties near universities or in fast-growing metros).
-
Convert to daily intake and peak-day needs. Divide your monthly forecast by roughly 26 operating days to get average daily intake, then multiply your average daily figure by 1.5x to 2x to estimate a realistic peak day, since deliveries cluster heavily on Mondays and the days following major sales events.
Worked example, 200-unit property:
Build this in a simple spreadsheet with rows for unit type, columns for month, and a separate tab for multiplier assumptions so you can stress-test conservative versus optimistic scenarios without rebuilding the model.
A forecast built on last year’s resident mix will drift fast once new leases change who’s actually ordering packages.*
What Drives Package Volume Beyond the Baseline
Baseline forecasts break down the moment you ignore the forces that push volume above or below trend. Four drivers deserve their own line item in any serious model.
- Holiday and promotional surges. Black Friday through New Year’s routinely pushes weekly volume toward double the baseline, and NMHC’s package delivery research documents this pattern across the industry. Build a distinct holiday multiplier rather than smoothing it into your annual average.
- Carrier mix shifts. Pitney Bowes data shows “other” carriers growing faster than the traditional big three, which means more delivery windows, less predictable drop-off timing, and more variability in how packages get logged and labeled.
- Oversize package growth. Furniture, appliances, and bulk grocery deliveries don’t fit standard locker compartments, and that category has grown steadily. Track oversize share separately since it drives space needs more than raw count does.
- Leasing cycle spikes. Move-in weeks, marketing promotions, and even a property-wide giveaway can create a short-term bump that looks like a trend but isn’t. Flag these as one-time events in your model, not baseline shifts.
Conference data presented at NMHC’s OPTECH event showed the share of communities seeing 400-plus packages a week during peak periods rising sharply. That trend line alone justifies building peak-season capacity into your model rather than treating the holiday rush as an anomaly you’ll deal with when it happens.
Converting Package Forecasts Into Space and Hardware Needs
A forecast is only useful once it tells you how many square feet, shelves, or locker compartments you actually need. That conversion has its own set of rules of thumb.
Open shelving typically stores more packages per square foot than fixed locker banks, because shelf space flexes to whatever size box arrives, while lockers are fixed compartments. The tradeoff: shelving needs staffing or managed visits several days a week to stay organized, while lockers automate resident notification and pickup but max out once every compartment is full.
Sizing guidelines to work from:
- Plan for a moderate number of packages per linear foot of shelf space, adjusting if oversize packages form a significant share of total volume
- Size locker banks to your peak-day forecast, not your average, since a bank that clears out daily during normal weeks will overflow during a holiday spike
- Reserve 20% to 30% overflow capacity beyond your peak-day estimate for unplanned surges tied to promotions or carrier delays
- Set aside dedicated floor space for oversize items separate from locker or shelf inventory, since a single mattress box can occupy the footprint of a dozen standard parcels
The decision between hardware and staffing usually comes down to one number: if your forecast shows sustained volume above roughly 300 packages a week with meaningful oversize share, a hybrid model, meaning lockers for standard parcels plus managed shelf space for oversize items, tends to outperform either pure system on its own.
Pro Tip: Don’t size for today’s forecast alone. Size for the growth scenario you consider “likely,” then treat “optimistic” as your overflow trigger, not your baseline design target.
Staffing Needs Tied to Your Package Forecast
Every package that arrives requires staff time for handling, scanning, and resident notification. Industry estimates put intake, logging, and resident notification time per package in the low minutes range, depending on workflow and software.
Run that math against volume and the staffing case becomes obvious fast:
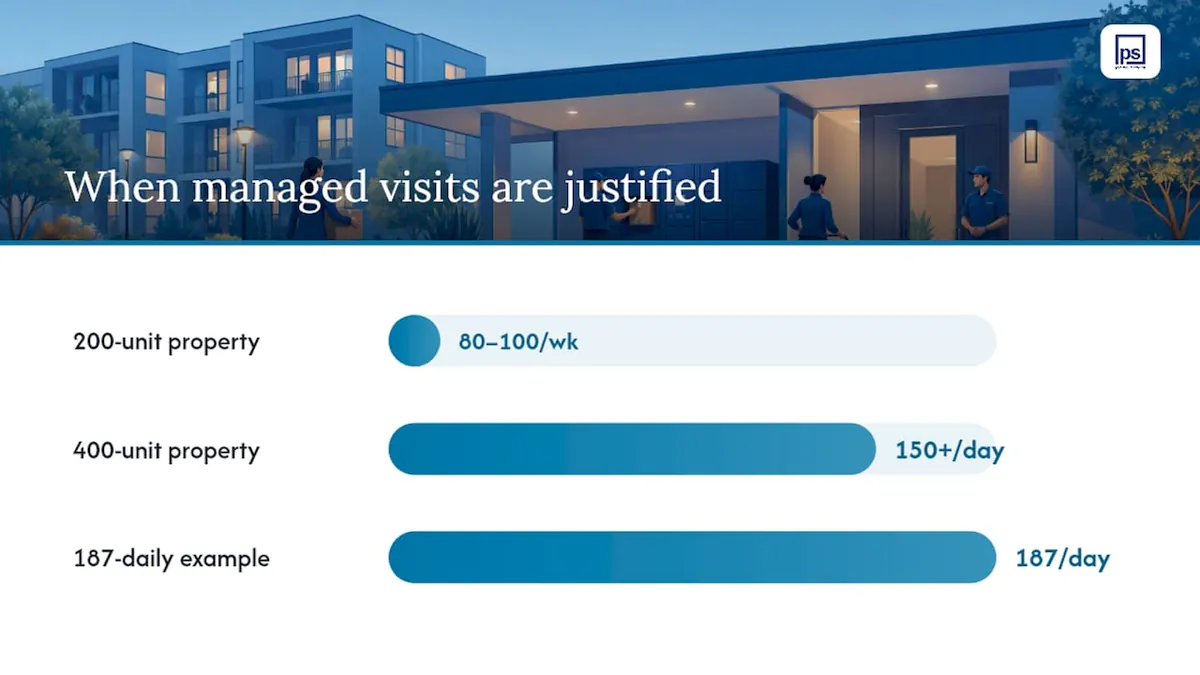
- A 100-unit property with moderate package volume needs a few hours of dedicated labor weekly, easily absorbed into existing roles.
- A 200-unit property at 80 to 100 packages a week starts justifying a part-time or daily managed visit, especially once weekly audits are added.
- A 400-unit property running 150-plus packages a day, consistent with the 187-daily case example, typically needs daily dedicated coverage plus a structured audit cadence to prevent misdelivered or lost-package disputes.
Once your forecast consistently clears that 80 to 100 packages a week mark, it’s worth evaluating managed package room visits rather than stretching leasing staff thinner. The threshold isn’t arbitrary. It’s the point where informal handling starts costing more in staff hours and resident complaints than a structured process would.
Implementation Checklist and KPIs to Track
A forecast without a review cadence goes stale within one leasing season. Build the checklist and the tracking rhythm at the same time you build the numbers.
- Baseline measurement: log a full representative week, including oversize share and dwell time.
- Unit-type rates: calculate per-unit-type volume and apply it across your actual unit mix.
- Capacity option selection: choose shelving, lockers, or a hybrid model based on your peak-day and oversize projections.
- Pilot period: run the new workflow or hardware for 30 to 60 days before locking in permanent staffing decisions.
- Review cadence: weekly during lease-up or peak season, monthly the rest of the year.
KPIs that actually validate a forecast:
- Packages per unit per week, tracked against your benchmark of up to 100 packages weekly for a typical community
- Average dwell time from arrival to resident pickup
- Percentage of volume handled through lockers versus manual shelving
- Staff minutes per package
- Peak-day factor, meaning your busiest day’s volume relative to your average
Postal Solutions: Matching Services to Forecast Thresholds
Founded in 2016, a company has spent over a decade specializing in daily mail and package management for apartment communities and student housing and has seen firsthand how forecasted volume translates into real operational thresholds.
When a forecast shows sustained volume that outpaces what leasing staff can manage informally, that’s typically the signal to consider six-day-per-week managed package room visits, where a dedicated coordinator organizes the room daily, labels units, and runs weekly audits. For properties whose forecasts point toward needing automated capacity, The company sells and installs Luxer One package rooms, lockers, and refrigerated locker systems, then supports the integration on an ongoing basis. A quick capacity evaluation can confirm which threshold your property has actually crossed.
Handling Returns and Reverse Logistics in Your Forecast
Returns don’t show up in most package volume models, but they should. A parcel that arrives, gets picked up, and comes right back out the door still consumes shelf space, staff time, and scanning workflow, twice over in some cases.
E-commerce return rates run meaningfully higher than in-store return rates across most retail categories, which means a property with heavy online shopping activity is also absorbing a steady stream of outbound return packages. Residents dropping off pre-labeled return boxes at the package room, or requesting carrier pickup from the same space, adds volume that a simple inbound-only forecast will miss entirely.

The practical fix is to track returns as a distinct line in your intake log rather than folding them into general package counts.
Reverse logistics also changes dwell time math. A return package sitting in a locker waiting for carrier pickup occupies that compartment just as long as an inbound parcel waiting for a resident, sometimes longer if pickup schedules are inconsistent. Factor that into your locker sizing, not just your shelf sizing, especially in markets where a specific carrier’s return pickup windows run inconsistent.
Author Perspective: What the Data Doesn’t Tell You
Measure first, always. Enforce carrier labeling compliance early, since messy hand-offs create more dwell time than volume ever does. And treat national indices as a sanity check, never a substitute for your own property’s counts. The properties that get burned every December are the ones that trusted an industry average over their own front door.
Turning Your Forecast Into a Working Package Room
Once the numbers point toward daily organizing, weekly audits, or a locker upgrade, the next step is putting a system in place that can actually keep pace with your projections. A service provider offers exactly that combination: managed package room organizing with six-day-per-week visits, structured weekly audits that cut dwell time, and direct sales and installation of Luxer One package rooms, lockers, and refrigerated locker systems, backed by ongoing integration support for the software commonly used.
For a property manager staring at a forecast that shows volume climbing past what current staff can absorb, the practical choice isn’t between doing nothing and hiring a full-time coordinator. It’s a managed visit model built specifically for this problem, sized to your actual numbers instead of a generic staffing formula. If your forecast points toward a capacity gap, request an evaluation through Postal Solutions to walk through which threshold your property has crossed and what a matched solution looks like.
Sources
- Pitney Bowes Parcel Shipping Index (2026)
- NMHC press release: New technology tackles holiday package delivery crunch
- A framework for solving multifamily’s package management problem | Insights by Blueprint
FAQ
How do packages typically work in apartment communities?
Carriers drop parcels into a shared package room or locker bank since USPS and most carriers cannot deliver directly into individual resident mailboxes. Staff or a managed service then organize, label, and notify residents for pickup.
How much would package management cost a 100-unit apartment complex?
Cost depends heavily on whether the property chooses managed visits, Luxer One hardware installation, or a combined approach, and specific pricing isn’t publicly listed. A forecast showing consistent volume near the NMHC benchmark of up to 100 packages weekly typically justifies evaluating a managed or automated solution rather than relying on informal staff handling.
How many packages are shipped daily across the U.S.?
U.S. parcel volume reached 23.1 billion shipments in 2025.
What is a package fee in an apartment community?
A package fee is a charge some properties add to cover the cost of managing high delivery volume, whether through staff time, locker system fees, or a managed service contract. Properties running forecasts above baseline benchmarks often use this fee to offset the added labor or hardware investment prompted by rising volume.